SitSat demonstrator - User Manual and Imprint
User Manual
General Usage Information
Use Guidance to be introduced to the features of SitSat. You will be guided through the most common use cases. tap/click the Guidance button (top right) to enter the guided mode. If you want to use SitSat without guidance, hit the Guidance button again.
In Expert Mode all functionalities and filter options are provided. This requires more knowledge about satellites and their features, but allows more complex queries. If you want to leave this mode, tap/click the Expert Mode again. This will get you back to the use case you have selected.
If you are in a use case, tap/click the arrow at the top left of the use case name to return to the starting point.
Start by selecting a use case.
Use Cases
We have divided the most common use cases into four groups. When you select a group, it expands to show subgroups.
Find satellites
SitSat finds satellites in several ways.
Search by name (or parts of it) or ID.
You can also search areas for satellites. The satellites that are over this place will be displayed.
Find time range
You can query a time period on satellites located over a location or area.
Find area (observed/unobserved)
Search for an area that is observed or unobserved by satellites.
Determine a region that is best suited for a certain activity.
Assess situation at location
Scenarios to assess the satellite reconnaissance situation for a site.
These use cases are a good introduction to SitSat.
User interface
The relationship between location, time and satellites is shown in different ways in different views. The user interface consists of views and select options that influence each other.
The best way to explore this is to go through the use cases and play with them.
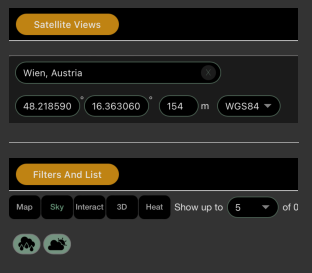
Place
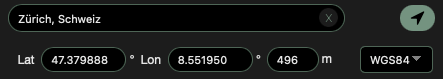
Set a place by entering a place name.
Set current location by clicking/tapping on the arrow button. The browser needs permission to do this.
Manual input of coordinates, optionally in WGS84, LV95 and CH1903 formats.
Crosshairs: In the map view (Map) a crosshair shows the selected location. The crosshairs can be moved on the map. This way the location is reset for the calculation of the satellite situation. The values in the input fields for the location and the coordinates change accordingly.
Time

Start: Sets the start time for the computations.
Duration: Sets the time period for the calculations. Computations for a duration longer than one day may take more time depending on the performance of the computer and the type of calculation. Therefore, these are marked with a red exclamation mark in the selection list.
Switch between local time and UTC by clicking / touching the button showing the time standard.
Timeline
The time bar /time line in the lower area of the screen extends over the period specified in "Duration".
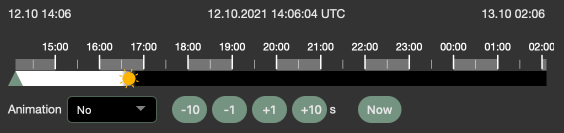
The green triangle can be moved in the time bar. Its position corresponds to the time displayed in the view.
Sunrise and sunset for the selected location are marked with a sun symbol. If it is daytime, the timeline is displayed bright, if it is night, it becomes black.
Animation: the display can be animated. You may set the speed.
Seconds buttons: Step 10 or 1 seconds forward or backward in time.
Now: Sets the start time to the current time. The selected duration is retained.
Filters
By filters we mean criteria according to which the set of satellites can be narrowed down.
Filters are properties of satellites (Name/ID, Country, Capabilities, Type of Use, Purpose, Constellation) and orbit data like azimuth, elevation and orbit.
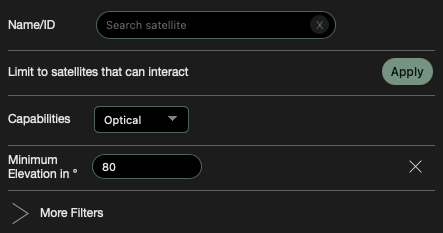
More Filters provides more options for narrowing down. If one is selected, it will appear at the top with the other filters. If a filter has already been applied once, the same filter will be added with an OR operation. Example: Country USA or CHINA will then show the satellites of both countries, i.e. both Chinese and US-American satellites.
The white delete cross to the left of the filters deletes the filters and expands the selection of satellites again.
Only those that can interact shows only those satellites with which a connection is possible at the given time. Click on the white delete cross to see all of them again.
List
List of satellites with name and ID. The list is not not sorted.
Triangle: expands the list item and shows detailed information about the respective satellite. The color of the triangle corresponds to the color of the satellites displayed in the view. In the detail view, tap/click on the small triangle to display even more information.
Eye: Double tap/double click on the eye: centers the corresponding satellite in the map view.
Show up to
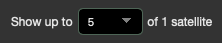
Setting how many satellites are displayed.
If too many satellites are selected, a warning is displayed. You may reduce the number of the satellites shown.
Map
2D Map view.
The ground track of the satellites is displayed in color. Click/tap on the ground track to a popup with the satellite name and an eye. Click/tap on this eye to show the current position of the satellite on the map.
White squares on the ground track mark the key data of the satellite orbit: highest elevation, rise and set points of the satellite above/below the horizon.
For the area of Switzerland the maps of swisstopo are used, worldwide those of Open Street map.
The Map view is convenient for setting a location with the crosshairs.
The weather buttons show the amount of precipitation (raindrops icon) and the degree of cloud cover (cloud icon) of the sky. Click/Tap to show and hide weather maps.
Sky
This view is a a stereographic projection of the sky over the selected location as its center. The gray border corresponds to the horizon line. The visible sky has a black background.
Satellites (dots) and their orbits (lines) above the currently selected position are shown. Dots and small squares can be hit to get more information about the Satellite.
The weather buttons show the amount of precipitation (raindrops icon) and the degree of cloud cover (cloud icon) of the sky. Another tap/click on these buttons leads to a weather map in the map view.
3D
This view provides an overview. The orbits of the satellites around the earth are displayed for the selected duration.
You may zoom out to see the entire earth and beyond.
Interaction
Displays the satellites on a linear time axis. The thick lines represent the time when interaction with the satellite is possible.
With the corresponding button the data can be exported for Excel.
Heat
The heatmap shows, which areas on the map can interact with a satellite during the given time span. Red means high satellite density, green a low one.
Hit a point on the map to see the satellites for that location.
Time
The time graph shows time line, that indicates, how many satellites can interact at the given time.
Hit a time to see corresponding satellites. Move the green markers to inspect the corresponding time span.
The green area represents the time longest time slice with the fewest or most satellites, depending on the use case.
The time span is framed by two green triangular arrows. You can move these. You may see the satellites displayed as colored lines above the blue bars.
iOS Version
We recommend using the iPad in landscape mode. We have optimized the views for larger screens.
Augmented Reality
The satellites above your location are displayed as dots on the camera background.
Touch the AR button in the Sky view.
You will see a square outlined in white. If it is transparent and not gray, the satellites can be displayed. Azimuth and elevation are displayed in the center. Search the sky for satellites. Have Fun!
Switch between list/filters and views
To make it work sufficiently well on small screens (iPhones, iPad portrait), you need to switch between filters and list on the one hand, and the different visualizations on the other.
Imprint and Licenses
SitSat Demonstrator is owned by armasuisse Science and Technology S+T
Developed by Andreas Garzotto GmbH
Data and Libraries:- swisstopo map material for maps within Switzerland
- swisstopo DHM25/200m digital height model for Switzerland
- Open Street Map data for maps outside of Switzerland
- satellite.js version 4.0.0 for satellite track computations
- Angular.js version 1.7.8 for user interface
- Leaflet version 1.6 for 2D maps
- Heatmap.js version 2.05 for visualizing heatmaps (satellite densities)
- Cesium version 1.7 for 3D visualisation (free edition)
- Flatpickr version3.0.6 for date selection
- Google Maps API for mapping between coordinates and place names